

Unlocking Global Trade Insights with a Worldwide Export Import Data Platform
2026-05-15
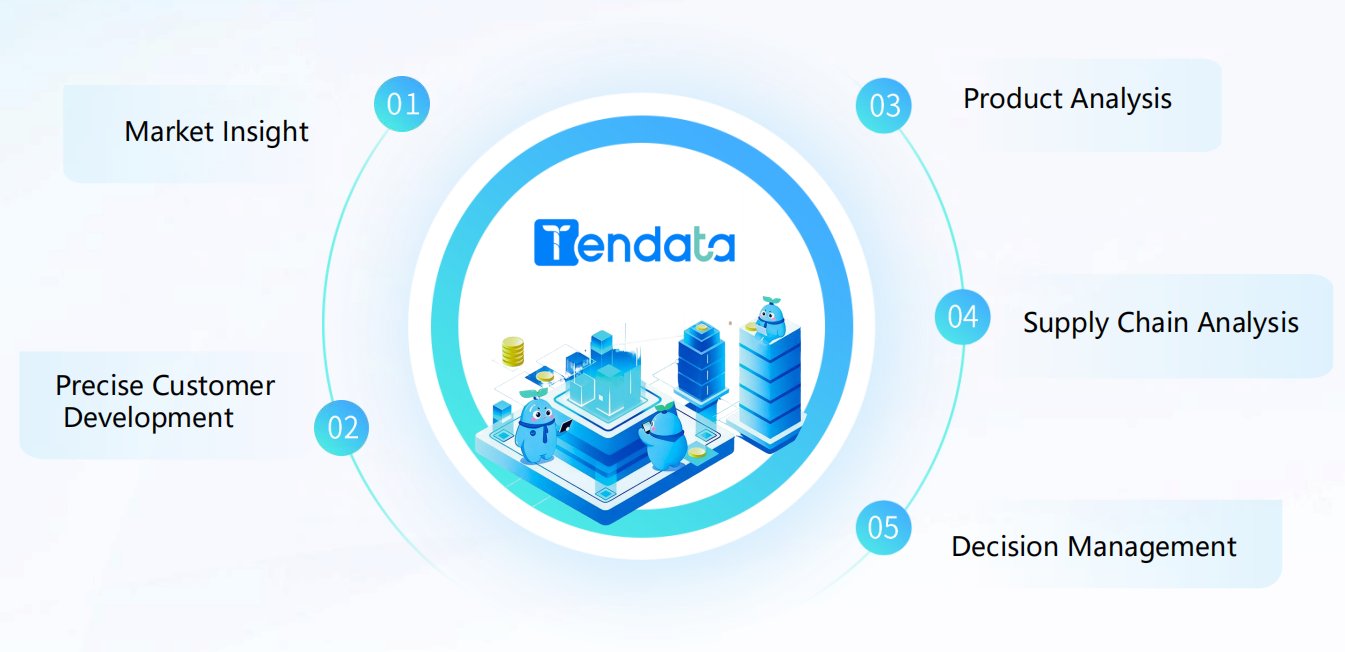
In a world where global trade shifts by the minute, having access to comprehensive export import data isn't just an advantage—it's a necessity. Enter Tendata, a platform that transforms messy trade figures into clear, actionable insights. Whether you're scouting new markets or monitoring competitors, the right data can mean the difference between seizing an opportunity and watching it sail away. Let's dive into how this tool is helping businesses navigate the complexities of international commerce with confidence.
Mapping New Trade Corridors with Live Data
Modern supply chains shift faster than static maps can capture. By tapping into real-time vessel movements, port congestion data, and satellite feeds, businesses now track emerging trade corridors as they form, rather than waiting for quarterly reports.
This approach doesn't just show where goods move today; it reveals subtle reroutings around bottlenecks before they become headlines. Analysts overlay commodity flows with geopolitical signals and weather patterns to spot durable shifts in global commerce.
Ultimately, live mapping turns reactive logistics into proactive strategy. Instead of guessing which routes will matter next quarter, companies watch them crystallize in the data, adjusting sourcing and inventory weeks ahead of competitors.
Turning Shipment Records into Market Foresight
Every shipment leaves a trail of data points—weights, routes, delays, and customs clearances—that, when analyzed together, reveal patterns invisible to the naked eye. A sudden uptick in expedited shipping in a specific region might signal an emerging demand hotspot, while persistent delays at a particular port can foreshadow supply chain bottlenecks before they hit the headlines. By treating shipment records as a real-time pulse of international commerce, companies can decode subtle shifts in consumer behavior and supply chain dynamics.
The key lies in moving beyond reactive tracking to proactive interpretation. For instance, comparing shipment volumes and transit times across different corridors often uncovers competitive maneuvers or capacity shifts weeks before official announcements. A manufacturer noticing a rival's surge of components into a new market can adjust its own strategy in advance. Similarly, analyzing the mix of product categories flowing through trade lanes helps anticipate changes in retailer inventory strategies, giving logistics providers and shippers an early-mover advantage.
Leading enterprises are now fusing shipment data with external signals—weather, socio-political events, and currency fluctuations—to build predictive models that inform procurement, inventory placement, and pricing. This turns a routine operational dataset into a strategic asset, enabling businesses to not just react to market changes, but to shape them. The foresight derived from shipment records is becoming a quiet superpower for those who know how to listen to what the data is saying.
Detecting Demand Shifts from Global Cargo Flows
Every container moving across the ocean tells a story about what the world wants right now. By tracking the volume, speed, and direction of these shipments, we can spot changes in consumption patterns long before official sales figures are released. A sudden spike in auto parts heading to a region might signal a local manufacturing boom, while a slowdown in electronics crossing the Pacific could hint at easing consumer appetite. These cargo flows act like a real-time pulse—raw, unfiltered, and often more honest than any survey.
What makes this approach powerful is its ability to capture nuance. Instead of just counting boxes, we look at the mix of goods: a rise in shipments of industrial machinery alongside a drop in finished products suggests companies are scaling back inventory and betting on future production. Similarly, when routes that normally carry seasonal goods start shipping earlier or in heavier volumes, it's often a retailer reacting to perceived demand shifts before they're widely reported. These patterns, pulled from billions of data points across trade lanes, give a granular view that traditional economic indicators miss.
The real challenge isn't collecting the data—it's separating signal from noise. Weather disruptions, port congestion, and carrier schedule changes can all distort shipping patterns temporarily. But over time, consistent deviations from historical norms reveal genuine shifts in demand, allowing businesses and analysts to adjust strategies while others are still waiting for quarterly reports. In a world where supply chains have become barometers of economic health, reading cargo flows has turned into both an art and a science—one that increasingly defines who moves first and who gets left behind.
Profiling Untapped Supplier Networks Instantly
Stumbling upon a supplier network that hasn't been overanalyzed can feel like discovering a trade route no one else knows about. The real challenge isn't just finding these hidden networks—it's turning their raw potential into something actionable before the window closes. Instant profiling tools now pull back the curtain on these overlooked clusters, mapping out relationships, capacities, and specializations within seconds instead of weeks.
What used to take a team of analysts digging through fragmented data can now surface as a clear, visual map of who supplies whom, where the redundancies live, and which nodes hold the most promise. This isn't about speed for the sake of it; it's about seeing the full picture while the market dynamics are still fresh.
When you can instantly profile an untapped network, you're not just ticking a box in a sourcing checklist. You're arming your procurement strategy with a real-time compass—one that points toward resilient, alternative supply lines that competitors haven't even noticed yet. The result isn't just cost savings; it's a structural advantage that gets harder to replicate the longer you wait.
Stress-Testing Supply Chains with Real-World Logistics
Most supply chain simulation tools rely on tidy assumptions: predictable lead times, stable demand, linear routes. Real-world logistics laugh at those assumptions. Ports get clogged, trucks break down, a sudden political flare-up closes a border crossing for days. When you stress-test with actual shipment data—down to the carrier-level delays, dwell times, and seasonal demand spikes—you stop theorizing about resilience and start proving where the gaps actually are. It’s the difference between a fire drill with a cheat sheet and a drill where the exits are unexpectedly locked.
Take a company shipping out of Southeast Asia during monsoon season. A generic model might suggest safety stock buffers, but real-world logistics data reveals the specific ports with the longest weather-related shutdowns, which alternative routes historically took over, and what that did to freight costs. Stress-testing with these granular insights forces a conversation about trade-offs: do you pay for premium air freight to meet a deadline, or renegotiate SLAs with customers ahead of the storm? The numbers become less of a forecast and more of a replay of past chaos—so you can map out decisions before the next disruption hits.
The point isn’t to model every possible disaster, but to build a culture that reacts faster because the scenarios are rooted in actual logistics events. When a buyer sees a supply chain risk score backed by real container tracking data and historical clearance times at a cross-dock, the urgency shifts from abstract to immediate. Teams start asking better questions: “What if our regular trucking lane is cut off—do we have a booking process for rail that won’t take three days to activate?” That’s the kind of operational edge you only get when the stress test feels a lot like last week’s near miss.
Gaining an Edge from Bill of Lading Intelligence
Many logistics managers still treat the bill of lading as just another document to file away after a shipment arrives. Those who take a closer look are discovering something far more valuable: a real-time stream of operational intelligence. By systematically extracting and analyzing key details—from container movement patterns to exception frequency across carriers—companies can spot bottlenecks weeks before they escalate into costly delays.
Beyond day-to-day troubleshooting, this data builds a historical picture that sharpens negotiation tactics. When renewal talks with ocean carriers come around, having hard numbers on transit time reliability, damage ratios, and hidden accessorial charges changes the dynamic. Instead of generic rate discussions, freight buyers can push for performance-based terms that directly reduce supply chain risk.
The shift from passive record-keeping to active intelligence gathering also creates a feedback loop with warehouse and inventory teams. Knowing exactly when a shipment started facing port congestion allows distribution centers to adjust staffing schedules and reroute inventory in transit. That level of visibility turns a static transport record into a competitive tool that keeps goods moving when others are stuck waiting for status updates.
FAQ
It aggregates and organizes customs records from multiple countries, giving you visibility into real shipment details—who's buying or selling what, quantities, pricing trends, and supply chain movements across borders.
By analyzing actual import and export patterns, companies can spot emerging markets, find reliable suppliers or buyers, track competitors' shipping activities, and adjust pricing or inventory strategies ahead of the curve.
Most platforms source directly from official customs declarations, bills of lading, and other government filings. While no source is perfect, this raw transactional data offers a highly accurate picture of physical trade flows.
Absolutely not—small and medium enterprises can use it to identify niche opportunities, vet overseas partners, and reduce reliance on middlemen without needing a huge research budget.
Free tools often lack granularity, timely updates, and advanced search capabilities. A dedicated platform provides cleaned, interconnected data, trend analysis, and customizable dashboards that save hours of manual digging.
Yes, it lets you monitor supplier shipment consistency, detect sudden drops in volume, identify alternative origins if a region faces disruption, and spot red flags like inconsistent trade routes before they impact your operations.
Update cycles vary by source country, but many platforms refresh data within days or weeks of customs clearance, so you're working with relatively current market intelligence.
You'll usually find details across nearly all HS code categories—from raw materials to finished electronics—and coverage of major trading nations as well as many emerging economies, often stretching back several years for historical analysis.
Conclusion
With trade dynamics shifting faster than ever, companies need a way to see beyond traditional reports. A worldwide export import data platform blends live cargo tracking with historical patterns to map emerging trade corridors—revealing, for instance, how rerouted vessels are opening new routes between Southeast Asia and South America. Instead of waiting for quarterly market summaries, teams can detect demand shifts directly from container flows: a sudden spike in auto parts from Mexico to Eastern Europe signals industrial expansion, while sustained agricultural exports from West Africa highlight underreported commodity trends. By turning raw shipment records into actionable foresight, decision-makers learn to anticipate disruptions and spot opportunities months before they appear on competitors’ radar.
Beyond visibility, such platforms let businesses profile untapped supplier networks instantly. Searching by product category and port pairings surfaces manufacturers that have never appeared in a trade directory but are actively shipping to neighboring markets. Stress-testing supply chains then becomes a hands-on exercise—simulate delays at a major transshipment hub using real-world logistics data and measure the downstream impact on inventory. The overlooked treasure lies in bill of lading intelligence: those granular documents detail carrier routes, consignee names, and precise cargo descriptions, offering a forensic view of what moves, how often, and at what cost. Combined, these insights empower importers and exporters to negotiate with confidence, diversify sourcing, and build resilience into their global operations.
Contact Us
Contact Person: Grace
Email: [email protected]
Tel/WhatsApp: +86 18721992033
Website: https://www.tendata.com